
Introduction
YOLO is a state-of-the-art, real-time method for object detection. It’s a fully convolutional network with an output tensor specifying bounding boxes for objects in the image. In this post, we’ll first talk about the way YOLOv2 uses to produce anchor boxes and then analyse the output tensor of YOLO and its loss function. At last, we’ll see how YOLO does object detection.
K-means Clustering for Anchor Boxes Generation
In light of the observation that good anchor boxes make it easier for the network to learn to predict good detection, and specializes for different scales of objects. YOLOv2 introduces a novel way to generate anchor boxes using k-means clustering.
In this way, it assumes all the bounding boxes are centered at one point so that only width and height are used as features. Instead of recourse to Euclidean distance, it employs IoU as distance metrics so as to alleviate bias towards large anchor boxes. More specifically, The distance metrics it uses is defined as
\[\begin{align} d(box, centroid)=1-IoU(box, centroid) \end{align}\]where centroid is a width-height pair. With these definitions, now we can apply k-means clustering to obtain \( k \) centroids for a start of our anchor boxes. In the paper, the authors suggest that \( k=5 \) gives a good tradeoff between model complexity and high recall.
Output of YOLO
YOLO takes an input image through a ConvNet, outputting an \( N\times N\times D \) tensor (e.g., \( N=13 \)). Each location in the \( N\times N \) map encodes \( k \) anchor boxes of size \( D/k \). Below is a general pattern of the encoded information for an anchor box
\[\begin{align} y=\left[p_o, t_x, t_y, t_w, t_h, p_1, ...,p_n\right]^T \end{align}\]The elements are grouped into three types
-
\( p_o \) encodes an confidence score for each bounding box using logistic regression. That is, \( \sigma(p_o)=P(object)IoU(b,object) \).
-
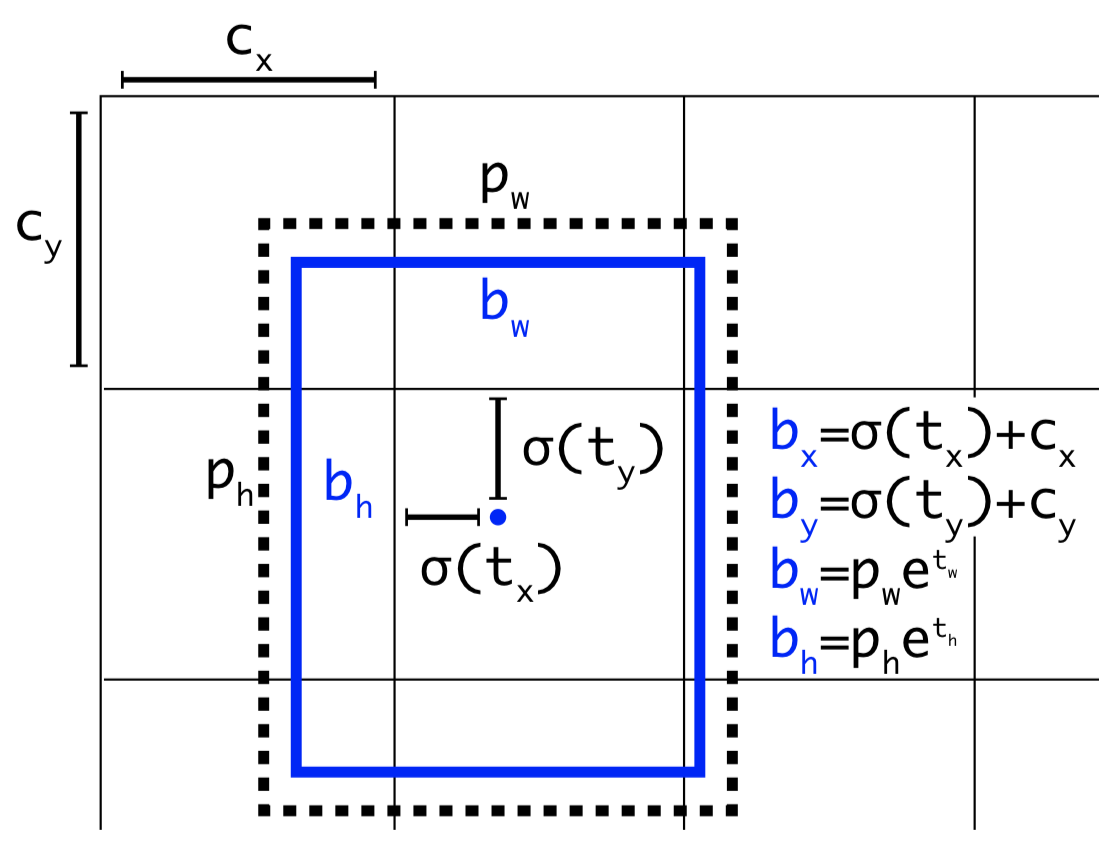
\( t_x, t_y, t_w, t_h \) encodes the offsets for an anchor box as below.
</figure>
where \( c_x, c_y \) are the coordinate of the current location, \( \sigma(t_x), \sigma(t_y) \) (which ensure the results are in range of \( [0,1] \)) are the offsets of the centroid from \( c_x,c_y \) w.r.t. the unit grid lengths, \( e^{t_w}, e^{t_h} \) (exponential ensures the results are greater than \( 0 \)) are the ratio of the width/height of the ground-truth box to those of the prior.
- \( p_1, …, p_n \) encodes the classification information predicted using independent logistic classifiers. More specifically, for each class \( i \), \( \sigma (p_i) \) is the conditional probability saying that if there is an object, how much likely the object is of that class
Loss
The common loss for YOLO found on the internet is the one from YOLOv1:
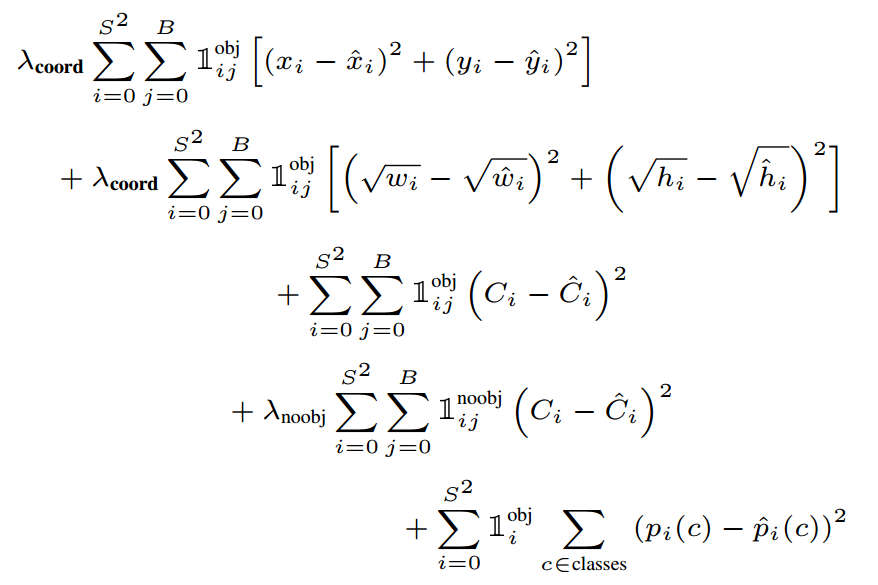
I omit the explanation for this loss function since there have been many well-defined explanation online.
However, noticing that YOLOv2 and YOLOv3 introduce anchor boxes and thereby have changed the loss a lot, I’m here trying to write the new loss according to the newest YOLO papers by myself.
\[\begin{align} \lambda_{coord}\sum_{i=0}^{S^2}\sum_{j=0}^B\mathbb 1_{ij}^{obj}\left[(\sigma(t_{x})+c_x-b_x)^2+(\sigma(t_y)+c_y-b_y)^2\right]_{ij}&\\\ +\lambda_{coord}\sum_{i=0}^{S^2}\sum_{j=0}^B\mathbb 1_{ij}^{obj}\left[(p_w e^{t_w}-b_w)^2+(p_he^{t_h}-b_h)^2\right]_{ij}&\\\ +\sum_{i=0}^{S^2}\sum_{j=0}^B\mathbb 1_{ij}^{obj}\left[\bigl(\sigma(p_o)-p(object)UoI(b, object)\bigr)^2\right]_{ij}&\\\ +\lambda_{noobj}\sum_{i=0}^{S^2}\sum_{j=0}^B\mathbb 1_{ij}^{noobj}\left[(\sigma(p_o)-0)^2\right]_{ij}&\\\ +\sum_{i=0}^{S^2}\sum_{j=0}^B\mathbb 1_{ij}^{obj} \left[\sum_{c\in classes}(-y\log\sigma(p_c)-(1-y)\log\sigma(-p_c))\right]_{ij}& \end{align}\]where the first two terms correct the anchor boxes, the third and forth terms the confidence scores, and the last logistic term the classification scores.
Object Detection
As described before, when we run an image through a ConvNet, we end up with an \( N\times N\times D \) tensor which encodes \( k \) anchor boxes at each location. At the detection stage
- We discard those anchor boxes with low objectness score \(\sigma (p_0)\le 0.6\)
- While there is still remaining boxes: pick the box with the largest \(p_o\), and output that as a prediction; Discard any remaining box with \(IoU \ge 0.5\) with the selected box (non-maximum suppression)
The remaining anchor boxes adjusted by their corresponding offsets are our eventual object prediction.
Limitations
YOLO has several limitations:
- It struggles with small objects that appear in groups
- It struggles to generalize to objects in new or unusual aspect ratios or configuration since it learns to predict bounding boxes from data
Comparison with Faster R-CNN
Comparing to Faster R-CNN, YOLO is dramatically faster than Faster R-CNN at the price of lower mAP (According to YOLO9000, however, this seems not a problem anymore)